Multiscale Model
Graphical Representation

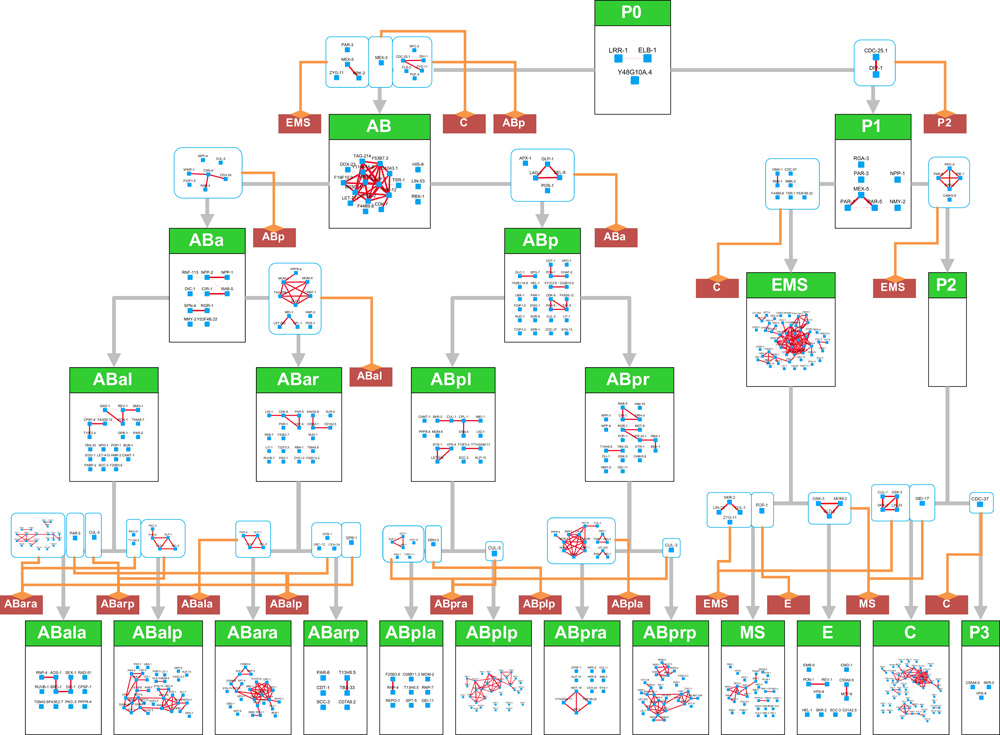
Multiscale Model: The box with a green title for each cell contains the cell specific gene network. The network contains genes that perturb a cell's fate, with links indicating interactions predicted by phenotype similarity. Gray lines indicate wild type differentiation. Orange lines branch off indicating genes that inhibit the alternative fates in the red boxes. The information synthesized here, network, phenotypic changes, homeotic transformations, is available in spreadsheet format on the Downloads page.